The Data Ingestion Pipeline
The goal of the connector is to get data (for example, time series data) from on-premise into the ThinkIQ cloud.
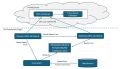
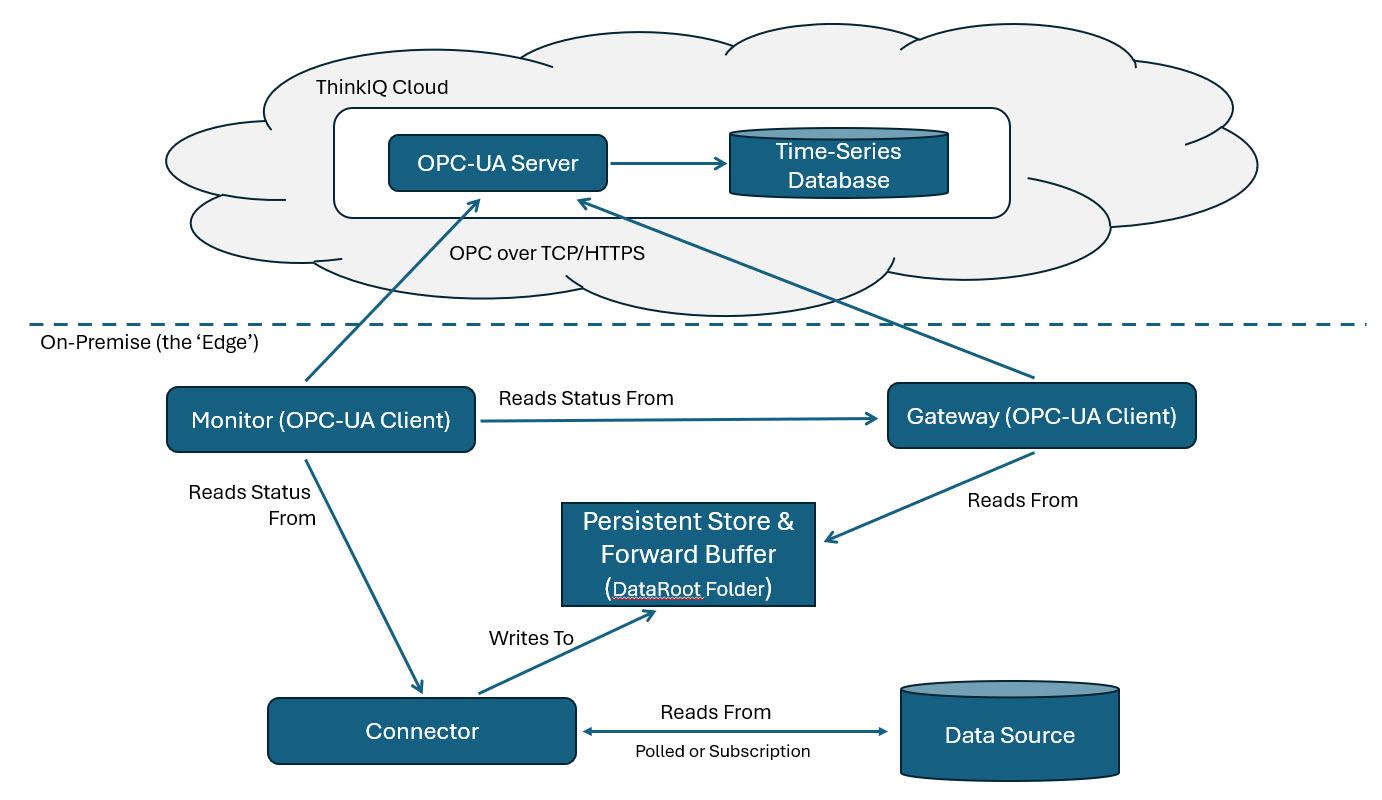
The Connector’s job is to read data from the Data Source and write it out to a Folder. The Gateway’s job is to read data from the same Folder and send it to the ThinkIQ OPC-UA server in the cloud.
- The Connector can receive data from the Data Source on a polled or subscription basis.
- The Folder represents a persistent store-and-forward buffer. How the buffer behaves is configurable within the SouthBridgeService.
- The OPC-UA Server (in the cloud) inserts data into the Time-Series database.
The Gateway and the Connector are loosely coupled. The default DataRoot Folder acts as an intermediary and ties the two together because the Gateway is reading from and the Connector is writing to this same folder.
On a Windows system, the Connector, Gateway, and Monitor are implemented as Windows services. These services can be installed:
- All on the same machine as the Historian
- All on a separate machine from the Historian
If installed on a separate machine, it is assumed that the Data Source machine will have the necessary permissions to access the DataRoot Folder.
On-Premise Services: The 'Edge'
Located between a customer’s Historian and a ThinkIQ system lies the ThinkIQ On-Premise Services Server (or just Connector Server for short) which is set up to facilitate the acquisition of the time-series data via a configurable number of ‘tags’. The three software Services which provide this capability are the Connector (the SouthBridgeService), the OpcUaNorthService (the Gateway), and the SystemMonitor.
These services can be stopped and started in the Services app on the machine they are installed on.
Connector – ThinkIQ.nnn.Connector: (SouthBridgeService)
- Generates ‘DataRoot’ folder and subfolders in the file path location specified by "DataRootDir" in:
C:\Program Files\ThinkIQ\Gateway\SouthBridgeService\appsettings.json - Monitors the Data Source and copies time-series data from the Data Source to the ‘DataRoot/HistData’ folder
- Performs the above at a frequency specified by "MinAcquisitionPeriodInSeconds" in:
C:\Program Files\ThinkIQ\SouthBridgeService\appsettings.json - Independent of the Gateway service
Gateway – OpcUaNorthService:
- Monitors the ‘DataRoot/HistData’ directory to see if any files are present.
- Location of the ‘DataRoot/HistData’ folder is specified by "DataRootDir" in:
C:\Program Files\ThinkIQ\Gateway\OpcUaNorthService\appsettings.json - If files are present, it sends (and deletes) any files contained in the ‘DataRoot’ folder to the cloud (i.e., to a Server, e.g., vjtiq6883glassfixes.thinkiq.net)
- The Data Ingestion Endpoint is defined in:
C:\Program Files\ThinkIQ\Gateway\OpcUaNorthService\ThinkIQ.NorthService.Endpoints.xml - Performs the above at a frequency specified by TBD
- Independent of the Connector service
System Monitor – ThinkIQ.SystemMonitor
- Sends the contents of the Connector and Gateway Log files to the history.tag_history_strings table.
- Updates all System Tags
- The location of the ConnectorLogDir and GatewayLogDir is defined in:
C:\Program Files\ThinkIQ\Gateway\SystemMonitor\appsettings.json - The Endpoint is defined by <EndpointUrl> in:
C:\Program Files\ThinkIQ\Gateway\SystemMonitor\ThinkIQ.SystemMonitor.Endpoints.xml - Independent of the Gateway and Connector services
Monitor
The monitor reads log data produced by the North and South Services, packages each line from the log files into its own Value Status Time (VST) and sends the VSTs to the OPC UA Server as OPC UA data. The log files are constantly monitored, and each new line added to the log files is read by the monitor and processed in real time.
In addition to the log files and making sure the services are running, the monitor also processes status information produced by the North (Gateway) and South Services. The following shows the complete list of VST tags the monitor may send to the OPC UA Server:
* Type = Boolean, name = ThinkIQ.System.Opc.Ua.NorthService.Running
* Type = Boolean, name = ThinkIQ.System.Opc.Ua.NorthService.DataFlowSeized - North Bridge stuck sending
* Type = Boolean, name = ThinkIQ.System.SouthBridge.Running
* Type = Boolean, name = ThinkIQ.System.SouthBridge.QueueFull -- Set if persistent file queue is full
* Type = Boolean, name = ThinkIQ.System.SouthBridge.HistSeized -- Set if not receiving history data
The above "HistSeized" tag is controlled by the South Bridge appsettings.json-> HistSeizedThreshold. The default value for this setting is 30 minutes. The tag is set to true if no history data is received within this time limit.
Default System Tags
All connectors inherit a set of system tags that are used to monitor system performance. These tags are historized by default and can be seen in the Tag List for the connector in Model Explorer. The easiest way to see these tags is to filter the tag list by entering ThinkIQ in the Display Name column. Hovering over the Display Name will allow reading the entire text.
ThinkIQ.System.Opc.Ua.NorthService.Connected
- Data Type: boolean
- Description: Indicates whether the NorthService is currently connected.
- Purpose: This tag is made for monitoring the connection status for a NorthService.
ThinkIQ.System.Opc.Ua.NorthService.DataFlowSeized
- Data Type: boolean
- Description: Signals whether the data flow within the NorthService has been seized or halted.
- Purpose: Helps identify interruptions or intentional halts in data transmission for diagnostics or control.
ThinkIQ.System.Opc.Ua.NorthService.Log
- Data Type: string.
- Description: Contains log messages or status updates from the NorthService.
- Purpose: Provides insights into operational events, errors, or other status changes for monitoring and debugging.
ThinkIQ.System.Opc.Ua.NorthService.Running
- Data Type: boolean
- Description: Indicates if the NorthService is actively running.
- Purpose: Used to confirm whether the service is in an operational state.
ThinkIQ.System.Opc.Ua.Server.VstWriteCount
- Data Type: integer
- Description: The total number of VST write operations performed by the OPC UA server.
- Purpose: Used for tracking activity and performance metrics of data writes.
ThinkIQ.System.Opc.Ua.Server.VstWriteErrorCount
- Data Type: integer
- Description: The total number of failed write operations encountered by the OPC UA server when writing the VST.
- Purpose: Helps diagnose issues in data transmission or server communication reliability.
ThinkIQ.System.SouthBridge.HistSeized
- Data Type: boolean
- Description: Indicates if the historical data flow in the SouthBridge service has been seized.
- Purpose: Useful for detecting data archiving interruptions or for maintenance operations.
ThinkIQ.System.SouthBridge.Log
- Data Type: string
- Description: Contains logs or messages from the SouthBridge service.
- Purpose: Used to track operational status and error messages for debugging and monitoring.
ThinkIQ.System.SouthBridge.QueueFull
- Data Type: boolean
- Description: Indicates whether the internal queue in the SouthBridge service is full.
- Purpose: Critical for monitoring queue overflow conditions that may lead to data loss or throttling.
ThinkIQ.System.SouthBridge.Running
- Data Type: boolean
- Description: Shows whether the SouthBridge service is currently running.
- Purpose: Verifies if the component is operational.
South Service Settings
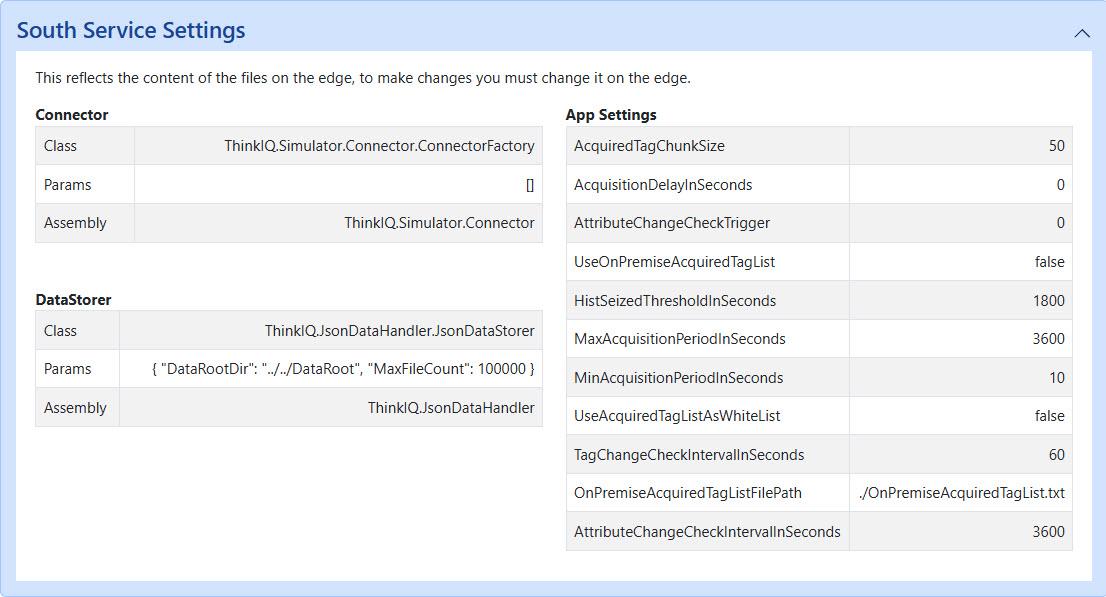
On the Overview tab of every connector is a South Service Settings section that you can drop open and review the settings for that particular connector. These settings control how data is acquired.
Variables in the App Settings section can be changed in the C:\Program Files\ThinkIQ\SouthBridgeService\appsettings.json file on the on-premise machine.
App Settings
Note that the default App Settings – those you will see after installing your connector - are different based on connector type.
When a connector is installed, it connects to the new data source and asks it what variables or tags exist and then sends that data to the cloud. This allows the ThinkIQ system to know the list of tags in the data source. These tags then show up in the Portal on the Tags tab for the connector. There are three variables that can alter this default behavior:
- UseOnPremiseAcquiredTagList
- UseAcquiredTagListAsWhiteList
- OnPremiseAcquiredTagListFilePath
The two tag list variables default to false, and the file path defaults to a text file in the South Bridge folder.
If the data source has a huge tag list and the customer does not want or need all of the tags, or if a customer would like to hide certain tags from discovery, these variables come into play. By setting UseOnPremiseAcquiredTagList to true, the connector will not search the data source for tags to import but will defer to the file in the OnPremiseAcquiredTagListFilePath varible.
Further, by setting UseAquiredTagListAsWhiteList to true, the system will know that these are the only tags that can be sent – ThinkIQ will not even know whether there are more (black) tags in the data source.
The purpose of the South Bridge Service is to monitor the data source and copy changed data into the DataRoot folder. Most of this data is time-series data that is changing rapidly, and the connector typically will receive those changes in real time on change. Before sending the data to the ingestion server in the cloud, the data is buffered, allowing the system to compress the packets and improve overall efficiency. There are two variables that manage the efficiency of that process:
- AcquiredTagChunkSize
- AcquisitionDelayInSeconds
The tag chunk size basically sets the size of the buffer by triggering on a total number of data changes, and the delay in seconds is the time period of the buffer, so if the delay in seconds is set to 30, the buffer will not send data more frequently than 30 seconds. These settings do not affect the resolution of the data; it only affects the latency of the data. The bigger you make these settings, the higher the latency.
By design, the connector will periodically scan the connector for new tag definitions and changes to attributes of tags, such as adding Engineering Units, or name or description changes. The next two variables control this behavior.
- TagChangeCheckIntervalInSeconds
- AttributeChangeCheckIntervalInSeconds
The tag change variable controls how often the system will ask if the definition of any tag has changed, and the attribute change variable does a similar thing, but goes a little deeper and will rescan the namespace of the item to learn about all of the things that have changed. This can be an expensive process and attributes do not change often, so this variable is set to a relatively large number.
Definitions coming soon:
- AttributeChangeCheckTrigger
- HistSeizedThresholdInSeconds
- MaxAcquisitionPeriodInSeconds
- MinAcquisitionPeriodInSeconds