Motivation
Storing json strings as time-series attributes works great to store complex event data and ticket-style data.
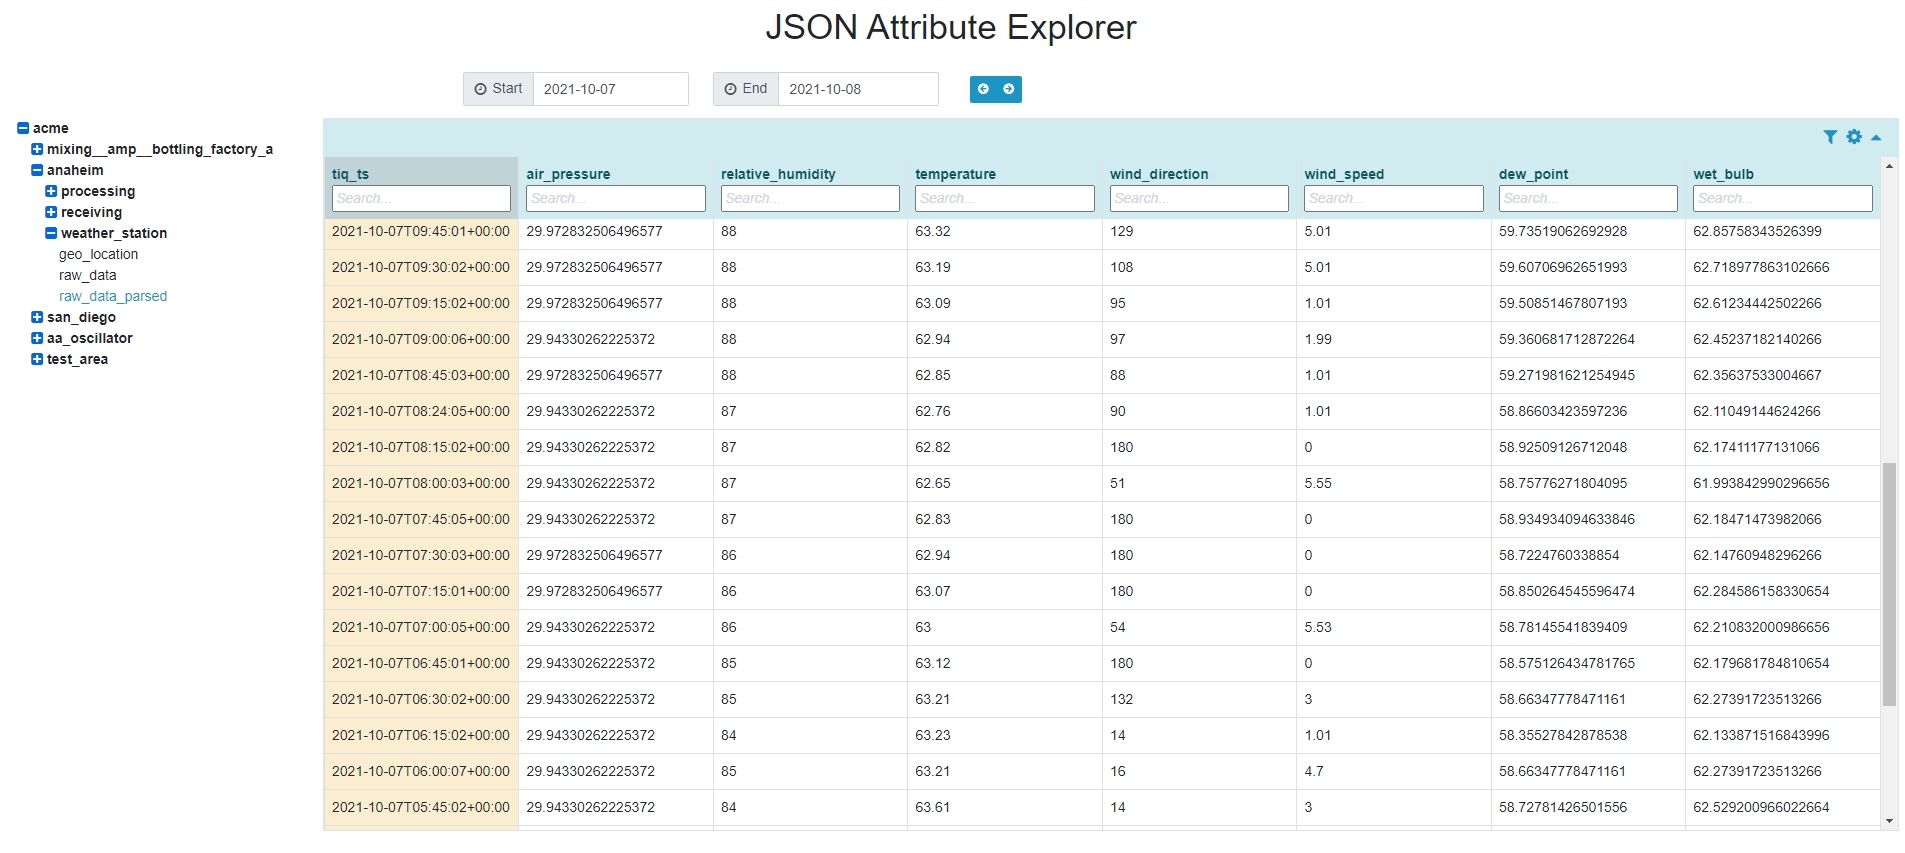
It would be nice to be able to see values over certain time spans: where typical numeric time-series data is charted, json objects can be shown in tabular form, or numeric properties can be charted.
Solution
The JSON Attribute Explorer is a custom component that lets you browse string attributes and show time-series data in tabular form.

Usage
To install the extension you need access to the administrator section of your CMS:
- Grab the zip file below and drag it into the Extensions->Manage->Install page.
- Access the JSON Attribute Explorer by browsing to ... thinkiq.net/?option=com_jsonattributeexplorer.
- Even better, create a menu link.
Download extension package here: jsonattributeexplorer.zip
Under the Hood
The GraphQL query to retrieve string attributes looks like this:
query MyQuery {
    attributes(condition: { dataType: STRING, dataSource: INTERNAL }) {
        id
        displayName
        fqn
    }
}
A sample mutation to upload json ticket-style data looks like shown below. Notice how we escape out the double quotes, and how we use a timezone specification to use plant time.
mutation MyMutation {
    replaceTimeSeriesRange(
        input: {
            attributeOrTagId: "2767"
            entries: [
                { status: "1", timestamp: "2021-02-01 04:05:06 America/New_York", value: "{\"variety_id\":\"208416\",\"weight\":\"27.42\",\"defects\":\"0.54\",\"overal_score\": \"7.8\"}" },
                { status: "1", timestamp: "2021-03-01 04:05:06 America/New_York", value: "{\"variety_id\":\"208416\",\"weight\":\"29.92\",\"defects\":\"0.44\",\"overal_score\": \"8.8\"}" }
            ]
        }
    )
    {
        clientMutationId
        json
    }
}
