The Raw Data Report provides a way to view the raw data for an attribute as it is stored in the timeseries database. The chart uses the familiar Duration Picker component to select time periods, and the Model Browser component for browsing the Model and selecting attribute(s) of interest.
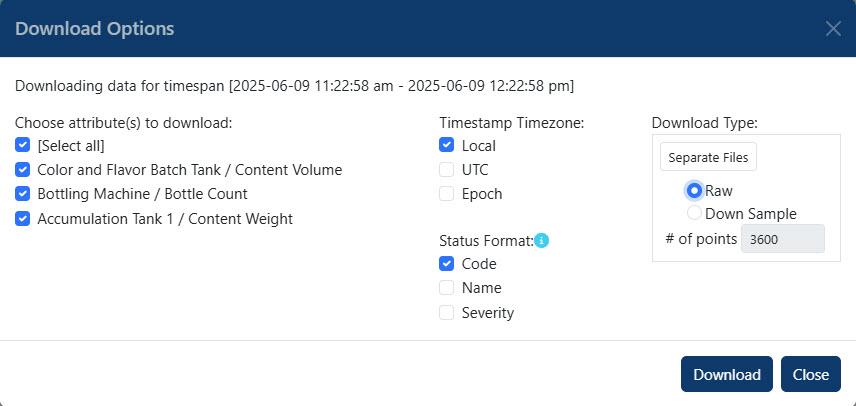
The Download Data button offers many options for downloading data into a CSV file.
- Choose attribute(s) to download: select all or specific attributes to include in the download
- Timestamp Timezone:
- Local
- UTC
- Epoch
- Status Format:
- Code - the status code assigned by the historian
- Name - the word that describes the condition or state of the process at a moment in time, for example, Good, Bad, Uncertain
- Severity -
- Download Type
- Separate Files
- When Raw is checked, the # of points to download is set at 3600
- When Download Sample is checked, the user can select the number of points to download
- Single File
- Allows downloading data points by a number of minutes, for example, a point for every 5 minutes
- Separate Files
In general, the grid will display value-status-timestamp for an attribute. ![]()
When successive attributes are added, the grid will reorder by timestamp descending, and will display only values by default: ![]()
The Show Status checkbox above the grid will add the status columns for each row to the grid: when clicked, the grid will display both the Status and the Status Name for the value. ![]()
When browsing an Event Object on its' own, the attributes inside the object will serve as the column names with the data displayed in the rows. ![]()
When adding an event object to other attribute types, such as integer, float or boolean, all of the attributes of the event will display in a singular column. ![]()