Overview
The Process Layout diagram is a rich display of plant data. Multiple layouts can be configured to show various configurations based on defined relationships in the Model. These relationships can be defined between Equipment, Places, Areas, or even Organization in the Model. Examples of such relationships are Can Feed, Can Consume, Supplies Water to, Supplies Electricity to, Sends Data to.
The diagrams are auto-generated from the Relationship Model that has been created in Model Explorer. When you create a new Process Layout diagram, many of the configuration options that are displayed come directly from what is configured in the Model Explorer. These include any featured attributes of a node such as a content weight, or whether a valve is open.
Process Layouts are configurable to fit the scope and content that match the task the user wants to perform, beginning with configuring the Place or Area to anchor the diagram, selection of feature attributes for equipment to display in the diagram, and the relationship types to display. A specific KPI Display can be configured on the Place or Area, making the diagram rich and informative at a glance.
Process Layout provides an overview diagram composed of a production or logistics process. It also provides tools to view and traverse the diagram. It can be used to examine details of nodes within the process. From a Process Layout diagram, a user can dive deeper into the system by directly navigating to Trend, Equipment Details, Model Explorer definitions, and more, while maintaining focus on a particular piece (or pieces) of equipment. Process Layout is the starting point for most of the navigation in the ThinkIQ platform and for many users it will act as their home page.
A platform can have multiple Process Layout diagrams that focus on different areas of a plant.
Navigating a Process Layout
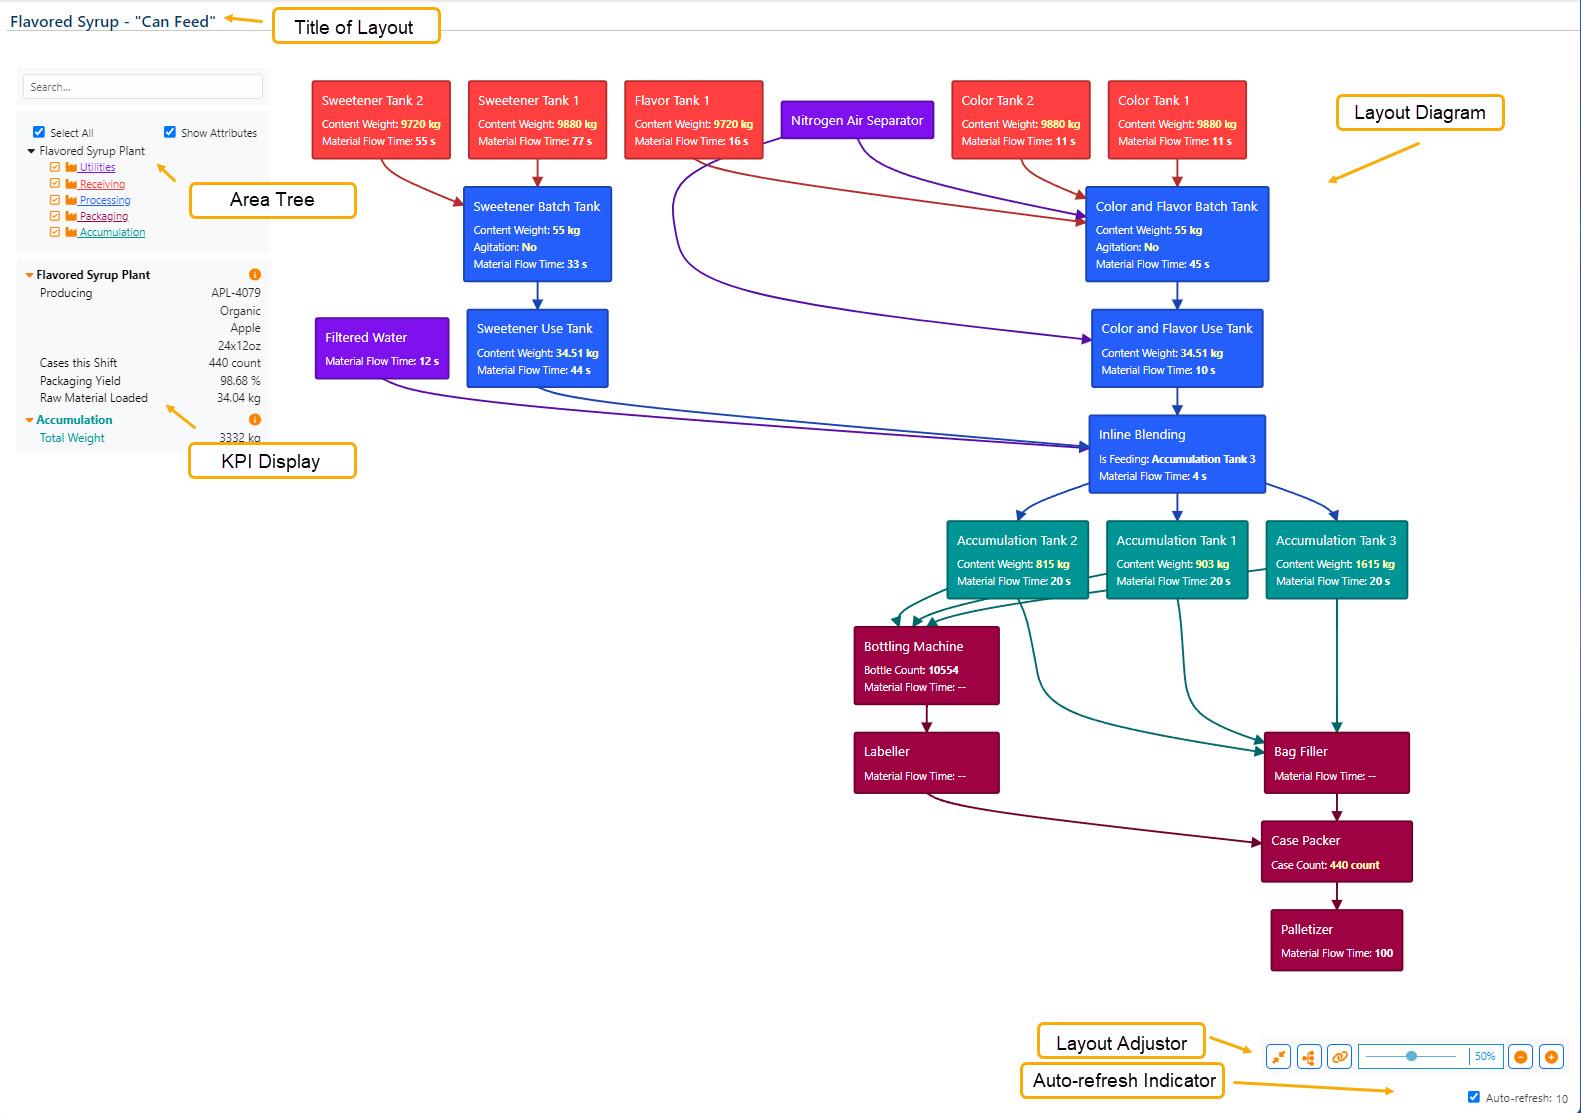
Referring to the image above (click to enlarge),
- Title of Layout The diagram title is set on the Page Display tab in the menu area of the Admin Console in the Page Heading field. (See Create a Process Layout) You can also set the Browser (tab) Page Title using the field Browser Page Title.
- Search Will highlight any nodes in the diagram where the title of the node matches the search term or part thereof.
- Area Tree The Area Tree is automatically built, displaying all areas that fall beneath the root node of the layout diagram. The order of the areas match the order set in the Model Explorer using the Order attribute displayed when editing the instance.
- KPI Display Any attribute set on an area can be surfaced in the KPI Display box in the Process Layout. The attribute can come from tags, expressions, or internally generated by a script, for example. Use the Hidden property to determine if the attribute should be hidden on Process Layouts (Hidden = 'true') or displayed (Hidden = 'false').
- Layout Diagram The diagram nodes can surface values for equipment nodes such as Content Weight, Running, Amperage, Flow, or Pressure. These 'featured attributes' are set in the configuration of the Process Layout in the Admin Console.
Clicking on a node opens a dialog that presents links to Trend, Equipment Details and more, opening those links with a specific focus on the selected node/instance. - Diagram Controls Allow controlling of several aspects of the layout: size of the diagram, directionality, zoom level, and includes the Auto-refresh Indicator. The Process Layout will auto-refresh every x number of seconds as set in the configuration of the Process Layout. Auto-refresh can be unchecked if desired. Diagram controls include a Layout Ranking for adjusting the layout of graph display.