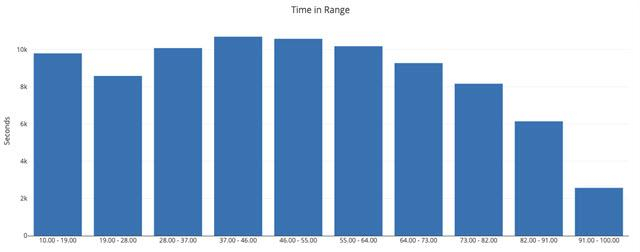
The Histogram Chart component allows the user to visualize the distribution of data values across a selected duration. The histogram chart is composed a bar chart and is typically paired with a duration picker.
Full documentation for this component including an interactive demo and code builder presently resides in the ThinkIQ platform under the Developer->UI Controls

